
What is an Indie Game?
Share:

Author: Ross Burton, PhD, Head of Product and Data
Category: Data Analysis
Published: 9/6/2024
Updated: 5/14/2025
There’s no strict rulebook for what makes a game “indie.” The term comes from “independent,” reflecting how these games are crafted by individuals or small teams without the financial muscle of big game publishers. It’s a bit like indie music and films, where creators work outside the mainstream industry structures.
The indie game scene has roots stretching back to the 1970s and 1980s, a time when personal computers were becoming more common. Back then, hobbyist programmers, affectionately called “bedroom coders,” would independently create and share their games through mail order and, later on, via the internet using shareware1,2.
Fast forward to the early 2000s, and the indie game movement exploded, thanks to technological advances and new business models. Platforms like Steam were pivotal, allowing indie developers to reach wider audiences without needing traditional publishers3,4.
However, the classic image of the lone developer striking it big through self-publishing has been challenged recently. The definition of an “indie” game has become a bit fuzzy, with some arguing that the term is now often used to describe a certain aesthetic or style rather than the actual development process. This shift can sometimes overshadow truly independent projects that depend on the indie label for recognition and success5,6.
Adding to the mix, we now have the rise of “Triple I” games. These are crafted by independent studios that bring high-quality design principles typical of AAA games but without the hefty budgets and large teams those usually entail7,8.
So, how do we navigate the indie landscape? Who should we be comparing ourselves to in market research, and how do solo developers keep their expectations realistic? In this article, we’re going to wade through the swamp of Steam data and explore three different definitions of “indie” titles. We’ll compare the number of releases, their performance (reviews and estimated revenue), pricing, and their uniqueness. Let’s dive in!
Definitions of Indie
We are going to explore three definitions of ‘indie’ games:
1. Steam Tags
The simplest definition which uses the user-defined ‘indie’ tag provided by Steam for game categorisation.
2. Solo & Self-published
Under this methodology games are categorised as being ‘indie’ if they meet all three of the following criteria:
- The game is developed by a single contributor/studio.
- The developer is also listed as the publisher on the game’s Steam page.
- The developer is not a recognised AAA studio (using a list curated from Game Oracle).
3. Revenue
The final methodology is using estimated lifetime revenue on Steam to categorise the developer and label games according to the developers category. The assumption under the revenue methodology is that developers who have published one or more successful games are less akin to the traditional definition of independent since their resources will grow with revenue. Using estimated lifetime revenue on Steam we categorise developers into the following:
- Getting Started - $0 to $10k
- Experienced Player - $10k to $100k
- Rising Star - $100k to $1m
- Big Cheese - >$1m
It is important to be aware that the assumptions made in these categories do not account for revenue generated through other platforms nor does it account for publisher contributions to a release (just because a developer is categorised as ‘Getting Started’ does not mean they are independently publishing - they could be collaborating with a publisher).
Steam Tags - A Misleading Characterisation
There are around 67,000 games that categorise themselves as ‘indie’ by using the Steam tag - that is 53% of games on Steam. As of May 2025, 20% of these ‘indie’ games are coming soon and 10% are in early access.
If we look at the latest pricing data below, we see a similar number of free-to-play games for both indie and non-indie titles, but there is a trend towards more expensive games amongst non-indie titles. Perhaps if the ‘indie’ tag is accurate this might make sense - we would expect larger studios to charge more for their games to account for the additional cost of making them.
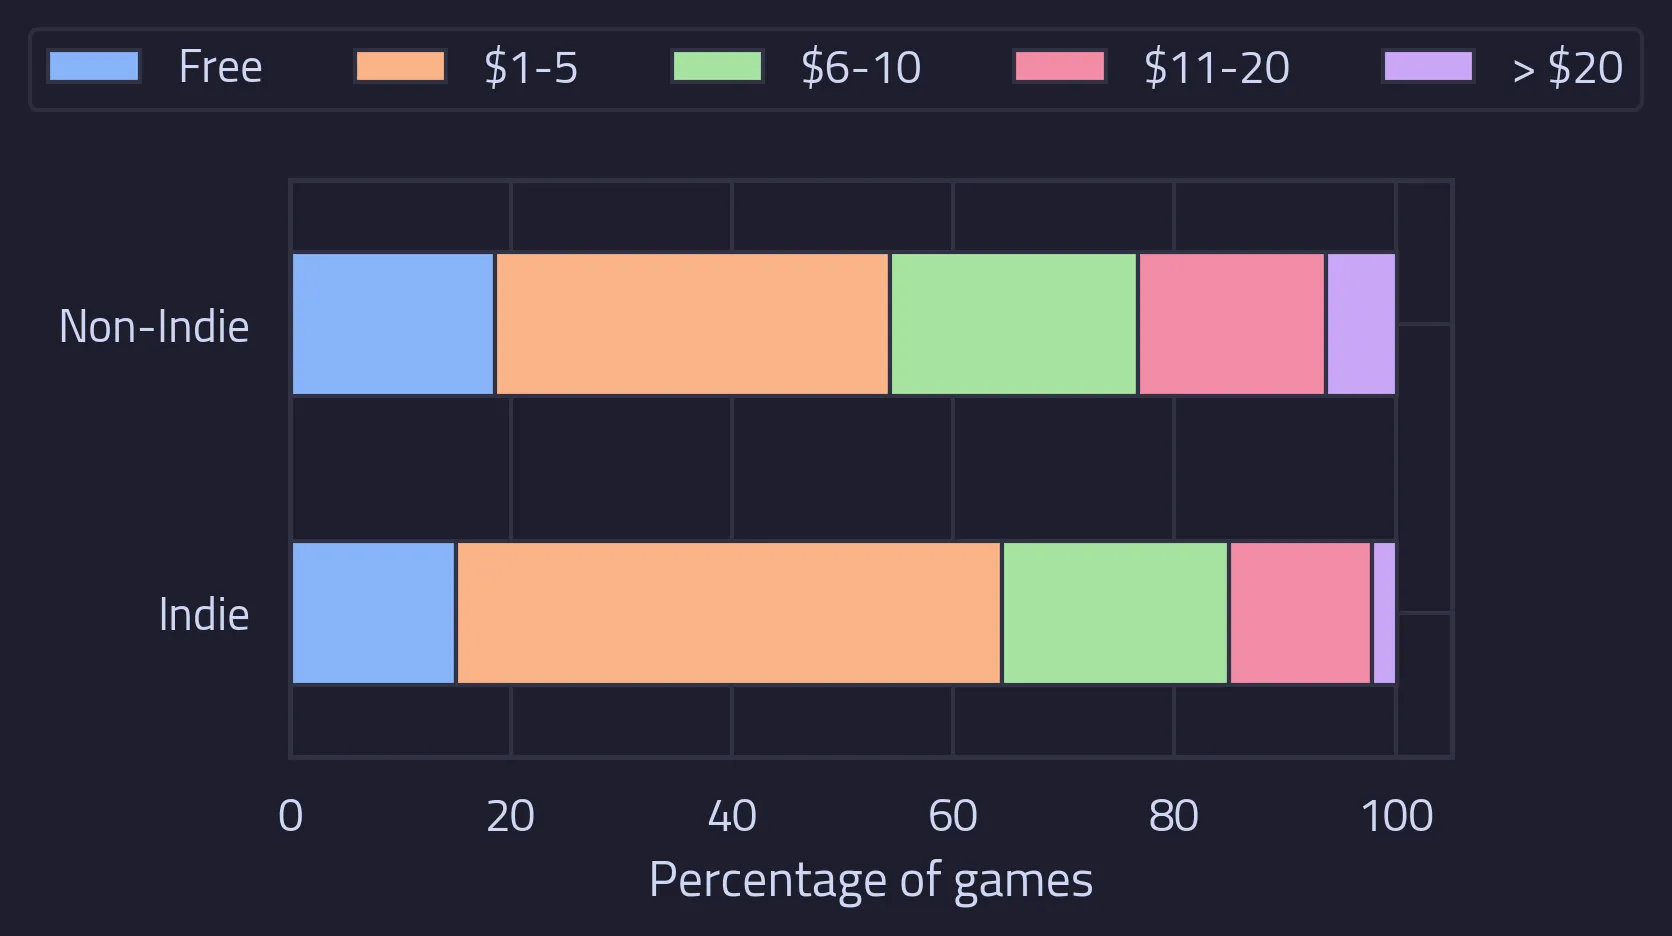
Prices of games when categorised by the Steam indie tag.
What about game performance in terms of reviews, sales, and revenue? We should first briefly speak about how we measure performance. Most analysis about Steam games on the internet talks about revenue or more precisely estimated revenue. Revenue is derived from the number of reviews that a game receives using the Boxleiter method or some modified Boxleiter method with extra jiggery-pokery - we go into depth about the different methods and what we do at Game Oracle in our article on estimated revenue. The TLDR though is that no one can really know what the true revenue of a game is, but its always estimated from the number of reviews. For the skeptics in the audience, always look to reviews as a more reliable metric of performance as opposed to the revenue estimate.
With that in mind, we will look at three metrics to gauge performance:
- Total number of reviews
- For games that have received more than 10 reviews, the percentage of reviews that are positive
- Estimated revenue using a modified Boxleiter method
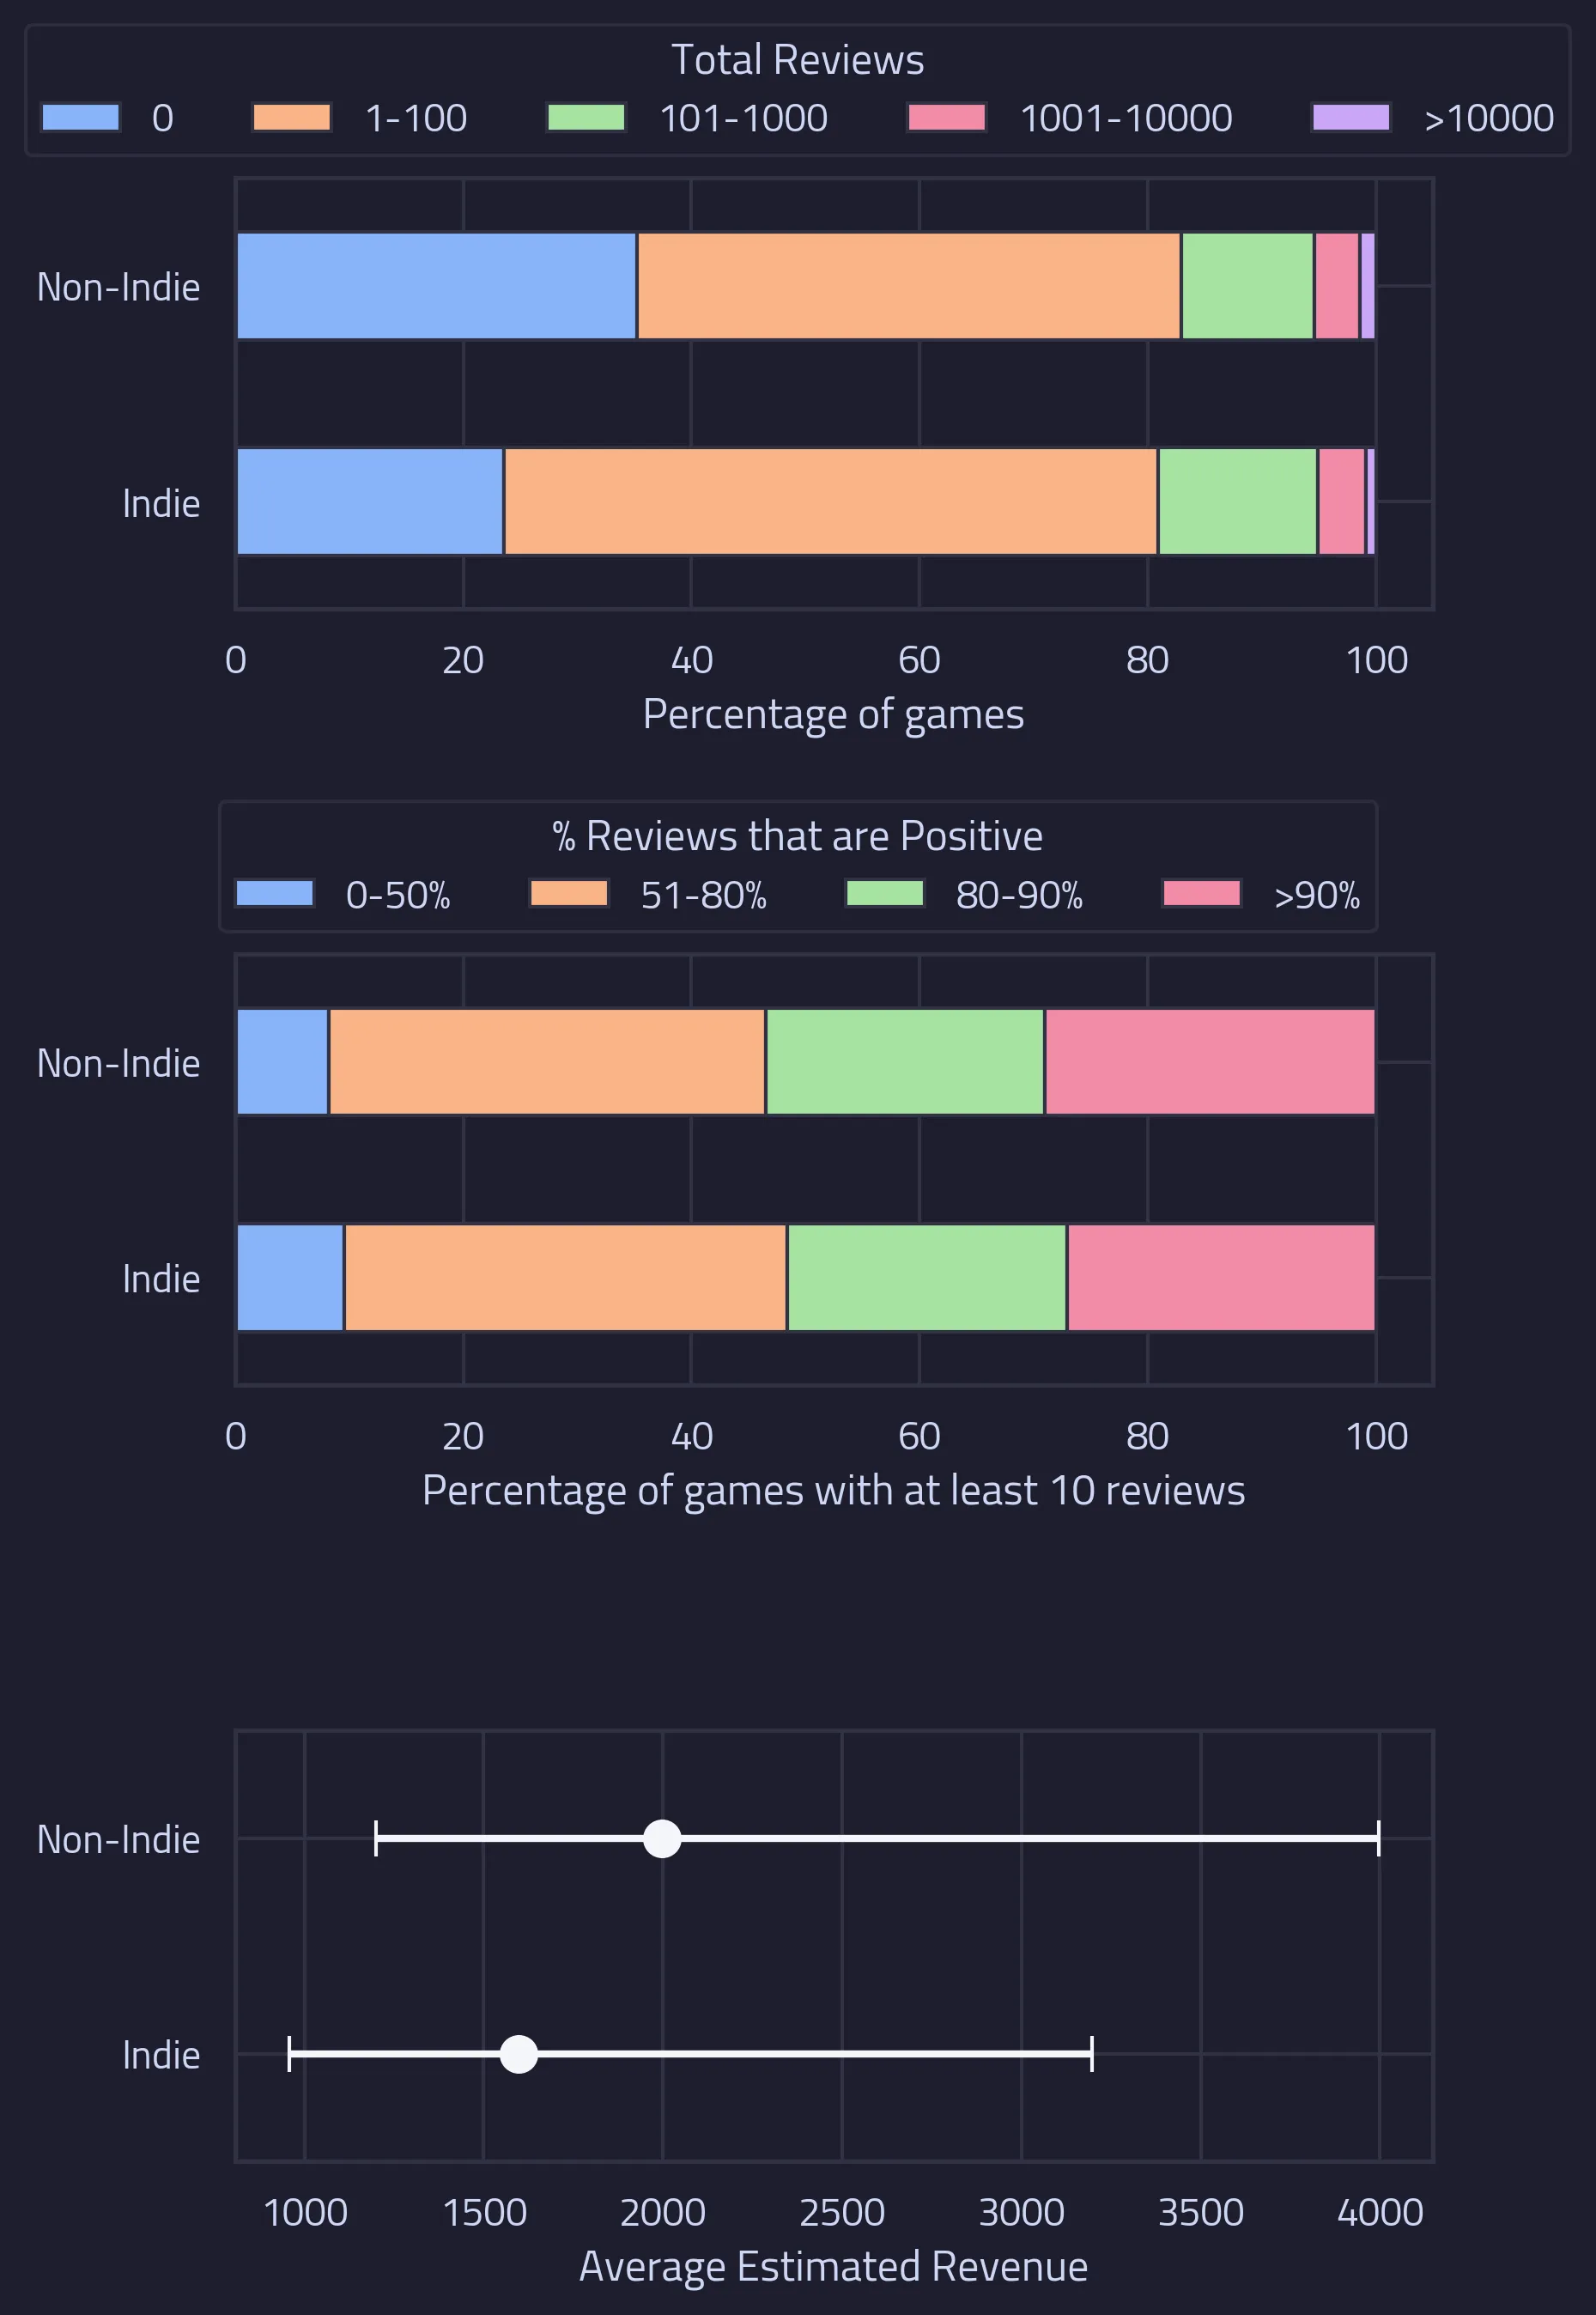
Performance metrics of games categorised by the Steam indie tag
The charts above tell us that despite indie and non-indie games receiving a similar proportion of positive reviews (middle chart), indie games receive more reviews overall and therefore have a higher estimated revenue (bottom chart; we show a range to capture some of the uncertainty around revenue estimates). That is quite surprising as you would imagine it would be the big studio games that grab more reviews and therefore have higher revenue estimates.
Thanks to our Steam Map and its novel measure of game ‘similarity’ we can do a little bit more than look at review data alone. We can also quantify how unique games are in each of the categories by measuring the distance between games on our map. This has produced these classifications:
- Copycats - games that have many extremely similar games to them on Steam (the distance between them and similar games on the map is less than average)
- Average Joes - games that have an average uniqueness because the distance between them and similar games is close to the average distance observed across the whole Steam map
- Innovators - games that are very different to the games around them on the Steam map
We can see in the top chart in the image below that the difference amongst indies and non-indies when it comes to uniqueness is minuscule.

Uniqueness and ranking metrics of games categorised by the Steam indie tag
Using our Steam Map’s measure of similarity, we can also rank games according to how they perform amongst games most similar to them. In the bottom chart of the above image we have shown what percentage of games in each category rank in the top 10 when compared to 100 similar games. Games are ranked according to the number of positive reviews received. As before, we see that games tagged as ‘indie’ on Steam out-perform those that are not tagged as ‘indie’ - a higher percentage of games rank in the top 10 when comparing the number of positive reviews amongst similar games. So what is going on? Are indie games genuinely more successful compared to their non-indie peers?
Probably not. The ‘indie’ tag can be very misleading. If we look at just a few examples we can see games that are very different to the traditional image of an ‘independent’ game developer. Take Golf With Your Friends, developed by a Brisbane-based trio at Blacklight Interactive but published under the massive Team17. This game was developed by a small team and perhaps is accurately tagged as ‘indie’, but it also had the might of a huge publisher behind it which could have contributed to its success.
Then there are more questionable uses of the tag ‘indie’ such as Skyworld, developed by Vertigo Games and Wolfdog interactive. Vertigo games has offices in three countries and is certainly not what we think of when describing a traditional indie developer or studio.
What about Wreckfest? It’s developed by BugBear, a team of 28 developers and the legends behind Flatout and Flatout 2. Again, despite being tagged ‘indie’ we have to question whether this meets the traditional definition of an independent.
The point is, the game titles mentioned above don’t conjure up the image of a developer working alone or with a group of friends to self-publish an independent title. So can we do better? Is it even possible to classify games as ‘independent’?
Solo & Self-published - The Lone Wolves of Steam
What if instead we were to classify games by their association with a publisher? It makes sense that ‘independent’ means ‘self-published’ and that is easy to spot on Steam because the listed developer and publisher will be the same. We also want to classify ‘solo’ developers if we can - it’s impossible to know if a game was developed truly solo, but we can exclude games where multiple developers are listed.
Lastly, there are cases where large studios, for example Rockstar, will both develop and publish a game, so we have manually curated our ‘Solo & Self-Published’ category and removed the obvious big players.
After applying our classification of ‘Solo & Self-Published’ we found around 86,000 games - that’s about 70% of games on Steam! Of those, 27% are listed as coming soon and 12% are in early access. Since others report the majority of games on Steam being ‘indie’ titles9, this seems like a more promising result compared to using the Steam ‘indie’ tag. Let’s dive into some more stats!

Prices of games when categorised by Solo and Self-Published definition
When comparing the pricing of indie games using this classification we see a very similar story as before - the indie games appear to have lower prices. What about when comparing performance?
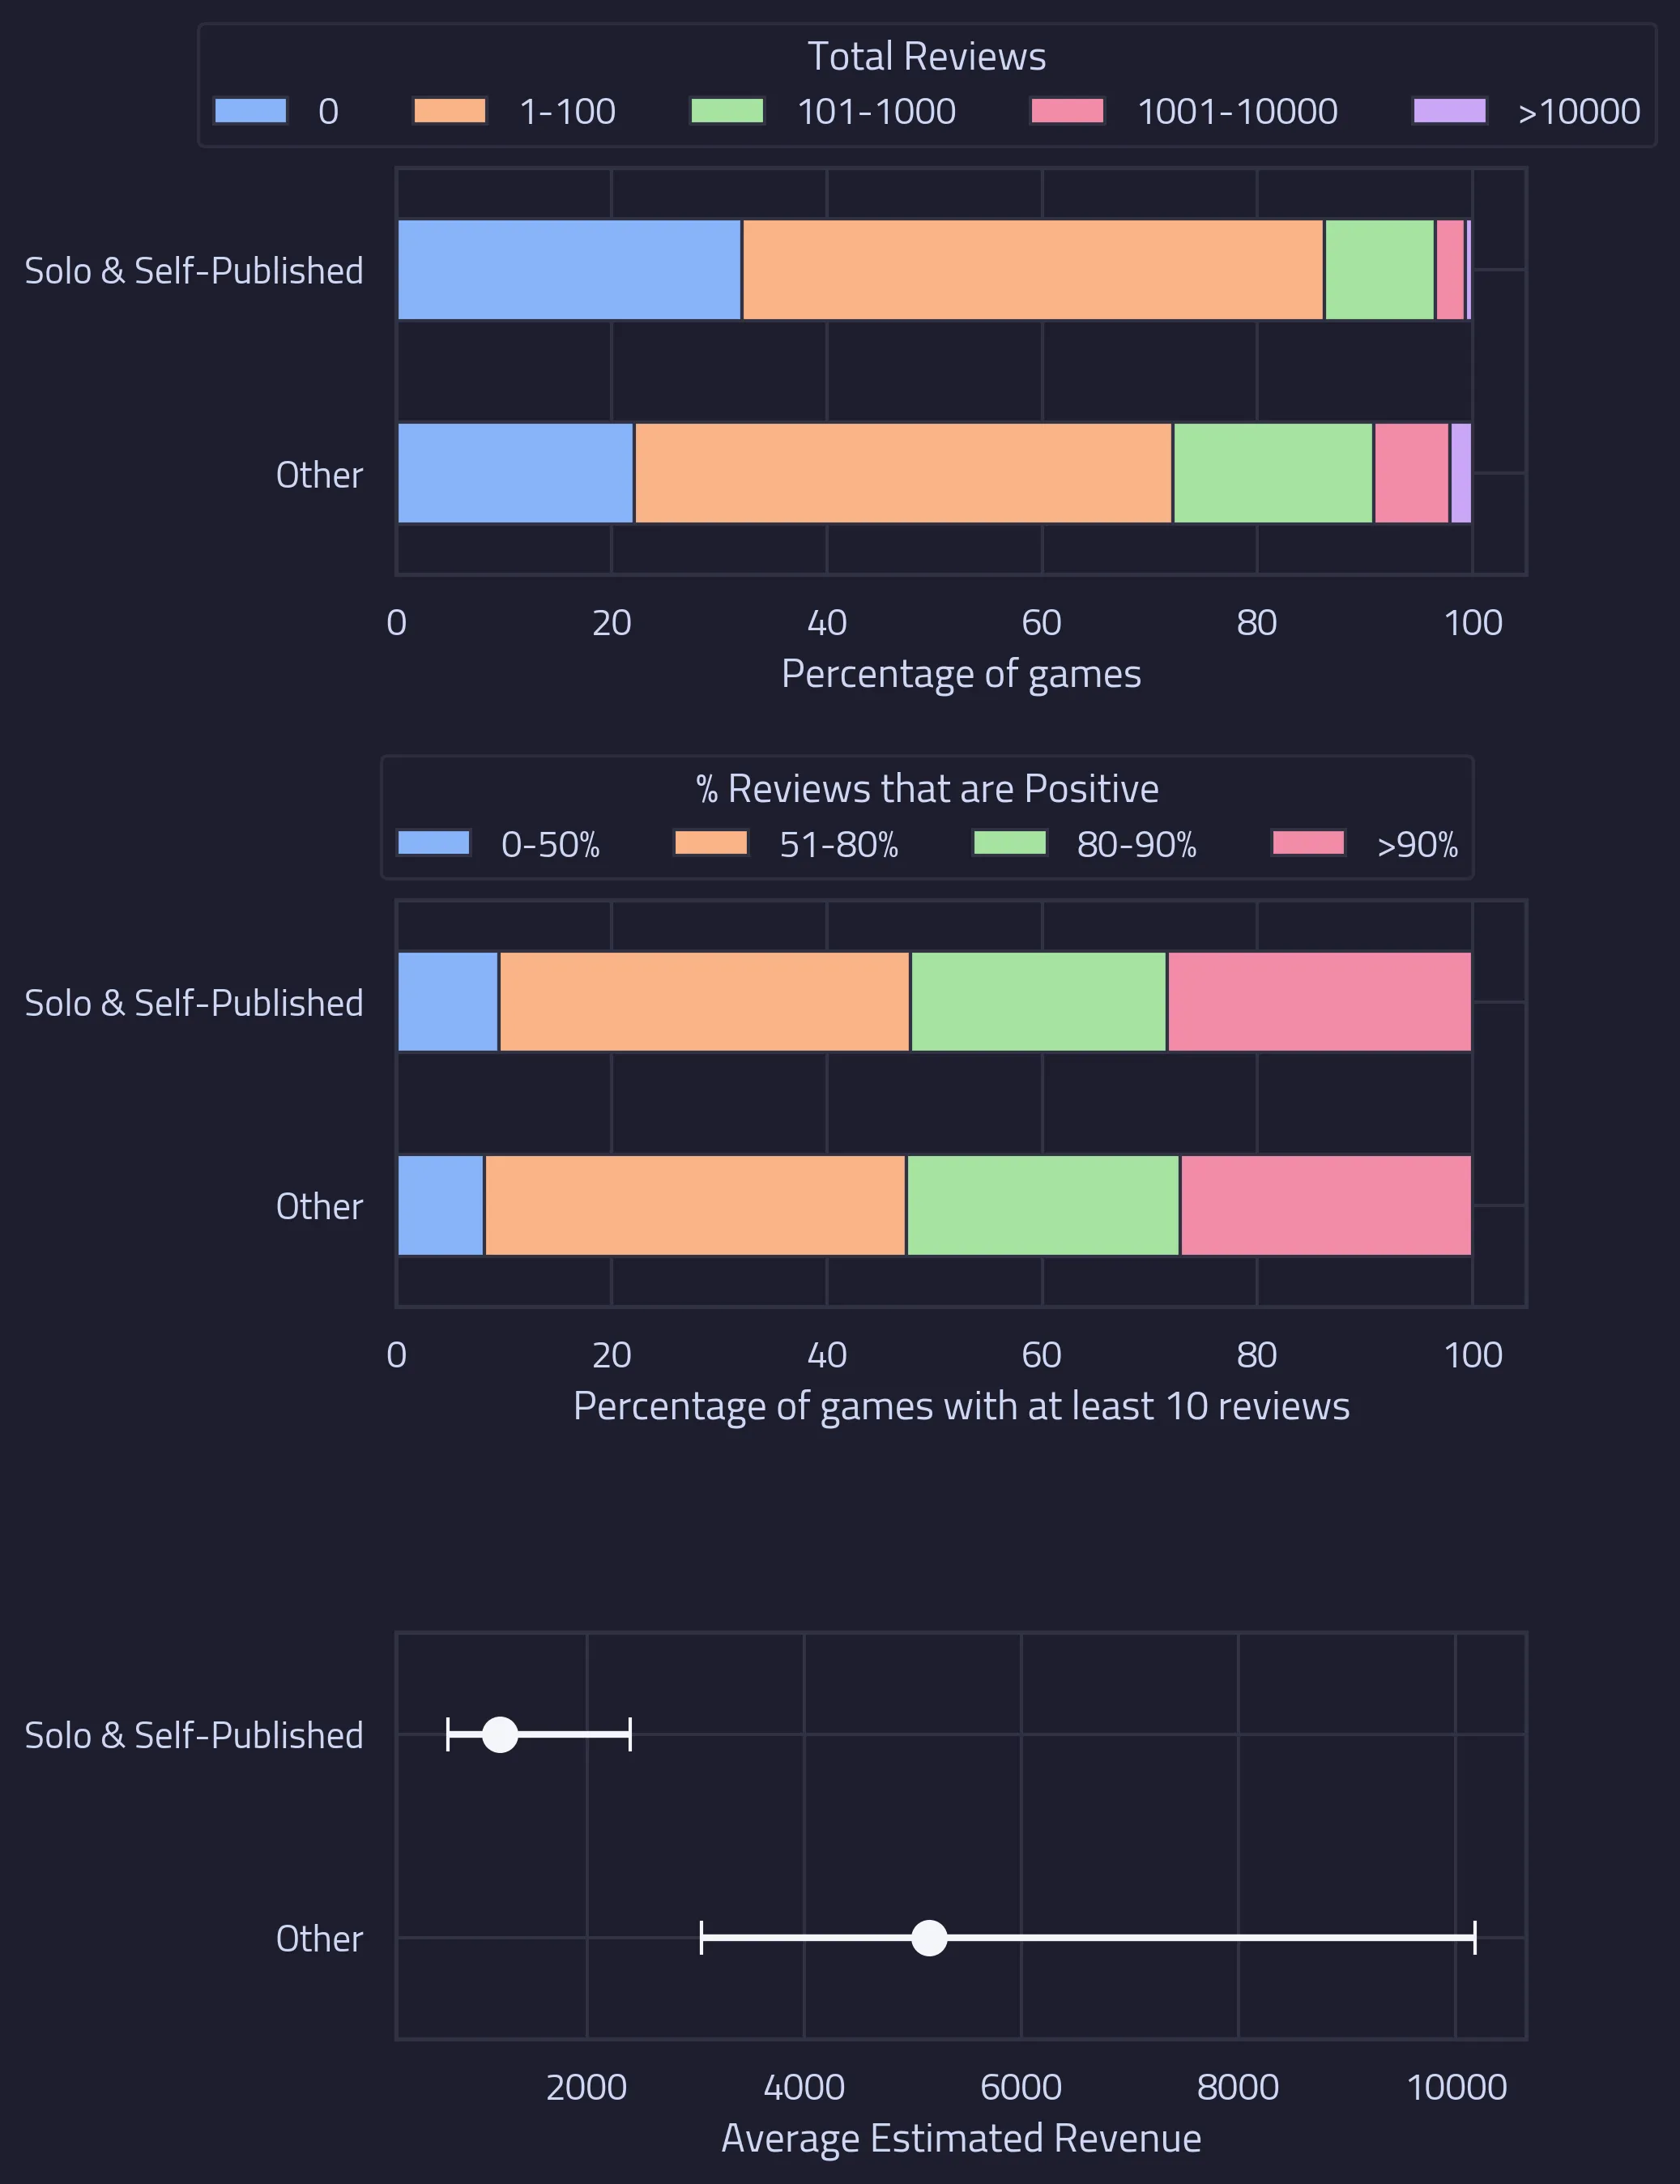
Performance metrics of games categorised by Solo and Self-Published definition
The picture here is comparable to what we saw before with the Steam 'indie' tag when comparing the number of games that received no reviews. However, that is a distinct difference when looking at the number of games that received over 100 reviews (the green, red, and purple sections of the top chart). Unlike with the Steam "indie" tag classification, there are far less games receiving over 100 reviews in the "Solo & Self-Published" category. This is reflected in the average estimated revenue for these games (bottom) chart, where "Solo & Self-Published" massively under-perform others.

Uniqueness and ranking metrics of games categorised by Solo and Self-Published definition
The message is echoed when we look at the performance of ‘Solo & Self-Published’ games amongst their peers. In the bottom row of the charts above we see that around 4.5% of ‘Solo & Self-Published’ games rank amongst the top 10 when compared to similar games in the Steam Map, compared to around 9% for games associated with a publisher or a big studio.
So the definition for ‘Solo & Self-Published’ games certainly meets the presumption that larger studios have greater success in terms of reviews and estimated revenue. One criticism of using this method to categorise indies would be the subjectivity around the self-publishers we chose to remove. We can’t identify independent studios that equal the might of a large publishing house and therefore no longer meet the traditional assumption of what an ‘indie’ is. If a studio is large enough it might not need a publisher. Without researching every developer on Steam it’s impossible to know.
We can therefore take an alternative approach and consider the resources a developer has based on their lifetime Steam revenue (the sum of estimated revenue for all released games). We tackle this in the next section.
Lifetime Revenue - A Fair Comparison Based on Resource
What if we estimate how much resource the developer has at their disposal. After all, the word ‘indie developer’ usually conjures up images of solo-developers working from their garage or spare bedroom, rather than boardroom meetings where suits discuss budget allocation. If we class developers by their lifetime revenue on Steam, that might give us a better classification. This approach doesn’t take into account other sources of revenue that might give a developer an advantage, but it’s the best we can do with the data we have. So, to remind you, we previously classified developers by the following using lifetime revenue on Steam:
- Getting Started - $0 to $10k
- Experienced Player - $10k to $100k
- Rising Star - $100k to $1m
- Big Cheese - >$1m
We can then classify each game according to the developers’ category. One caveat is that unicorn top-hit indie games that make millions of dollars will obviously be misclassified; we might end up calling that lucky indie in his spare bedroom a ‘big cheese’ because they struck it big on their first game, so we should keep that in mind.
| Category | Total Games | % Coming Soon | % Early Access |
|---|---|---|---|
| Getting Started | 83,344 | 33.1% | 12.6% |
| Experienced Player | 19,512 | 9.7% | 9.1% |
| Rising Star | 13,254 | 10.5% | 7.4% |
| Big Cheese | 9144 | 8.2% | 6.1% |
When we break down games into these categories, the first obvious finding is that the majority of games are coming from developers that have no prior success on Steam. We also see that just over 30% of games from these developers are listed as ‘coming soon’ and 12.6% are in early-access. These proportions are much higher than their experienced/ successful counterparts.
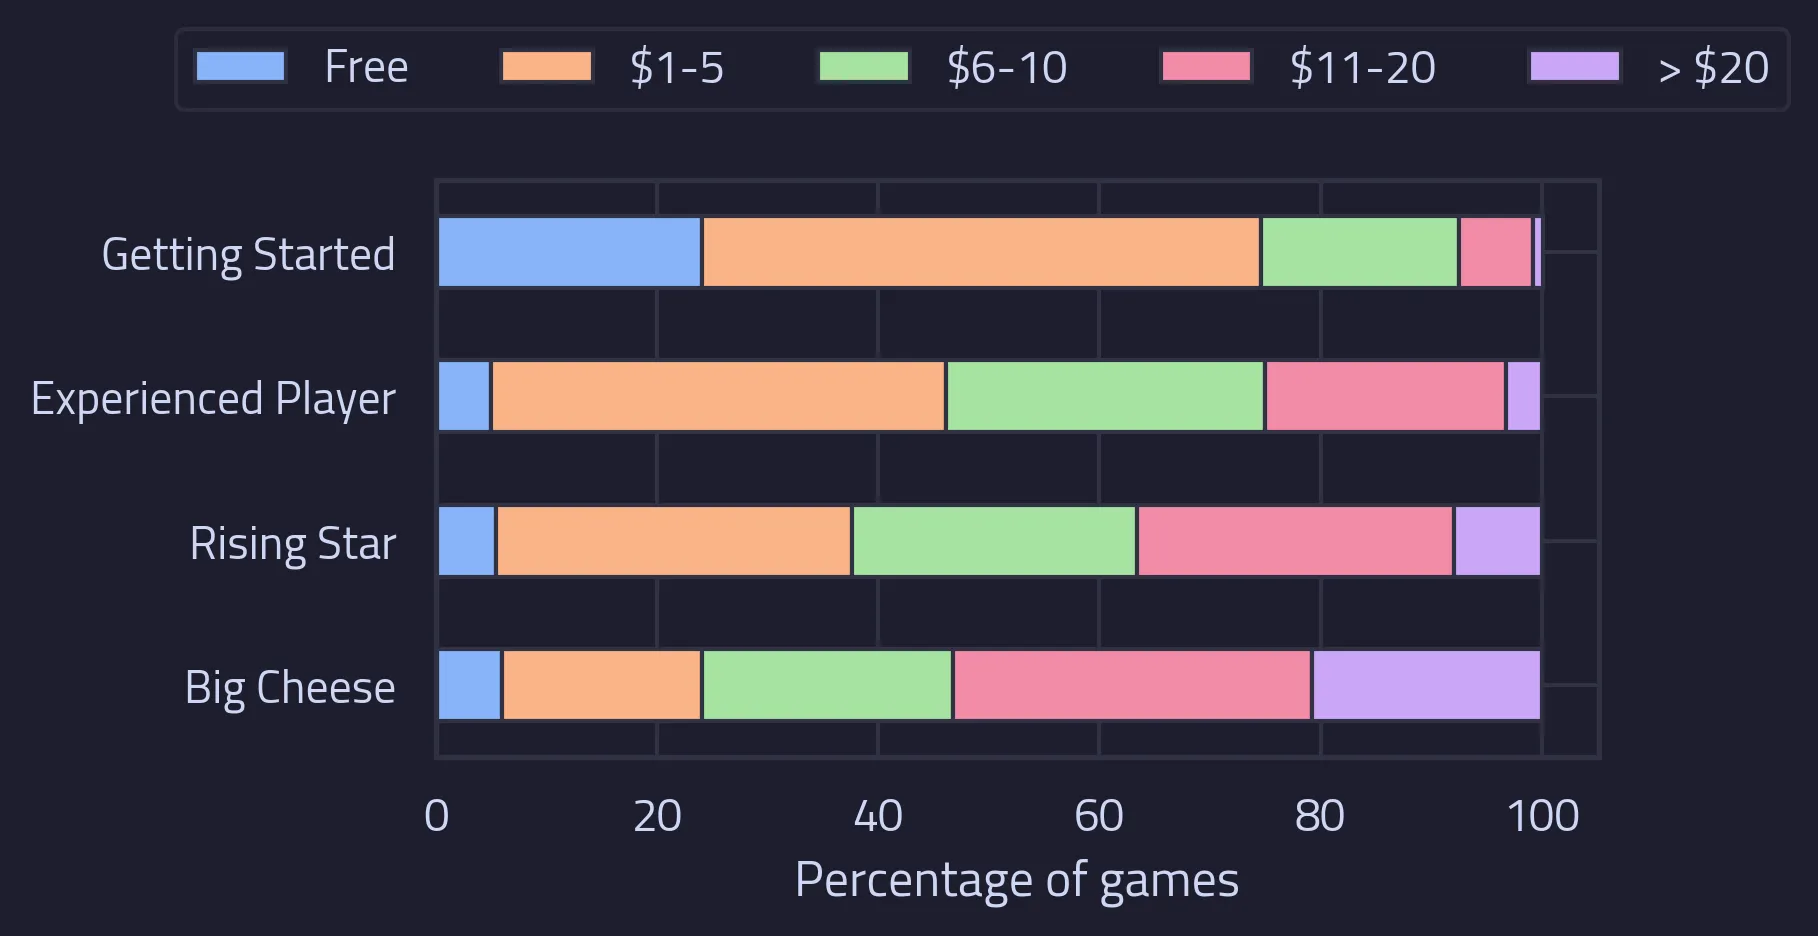
Prices of games when categorised the lifetime earnings of the developer
When it comes to pricing there are no surprises - the bigger players are charging more for their games. The budget for these games will likely be significantly higher given their greater resources, so it makes sense that the games would demand a higher price and this trend seems to follow a gradient from the lowest earners to the highest. What is surprising however is the sheer number of "Getting Started" developers that are releasing games for free compared to the other lifetime revenue categories. Perhaps many of these developers are dipping their toe in the water still and don't feel confident charging for their titles yet? It certainly came as a surprise to use, since you would expect more free games from the ‘Big Cheese’ category who can take the risk of releasing a free game and not recouping the $100 fee for releasing on Steam.
What about performance?
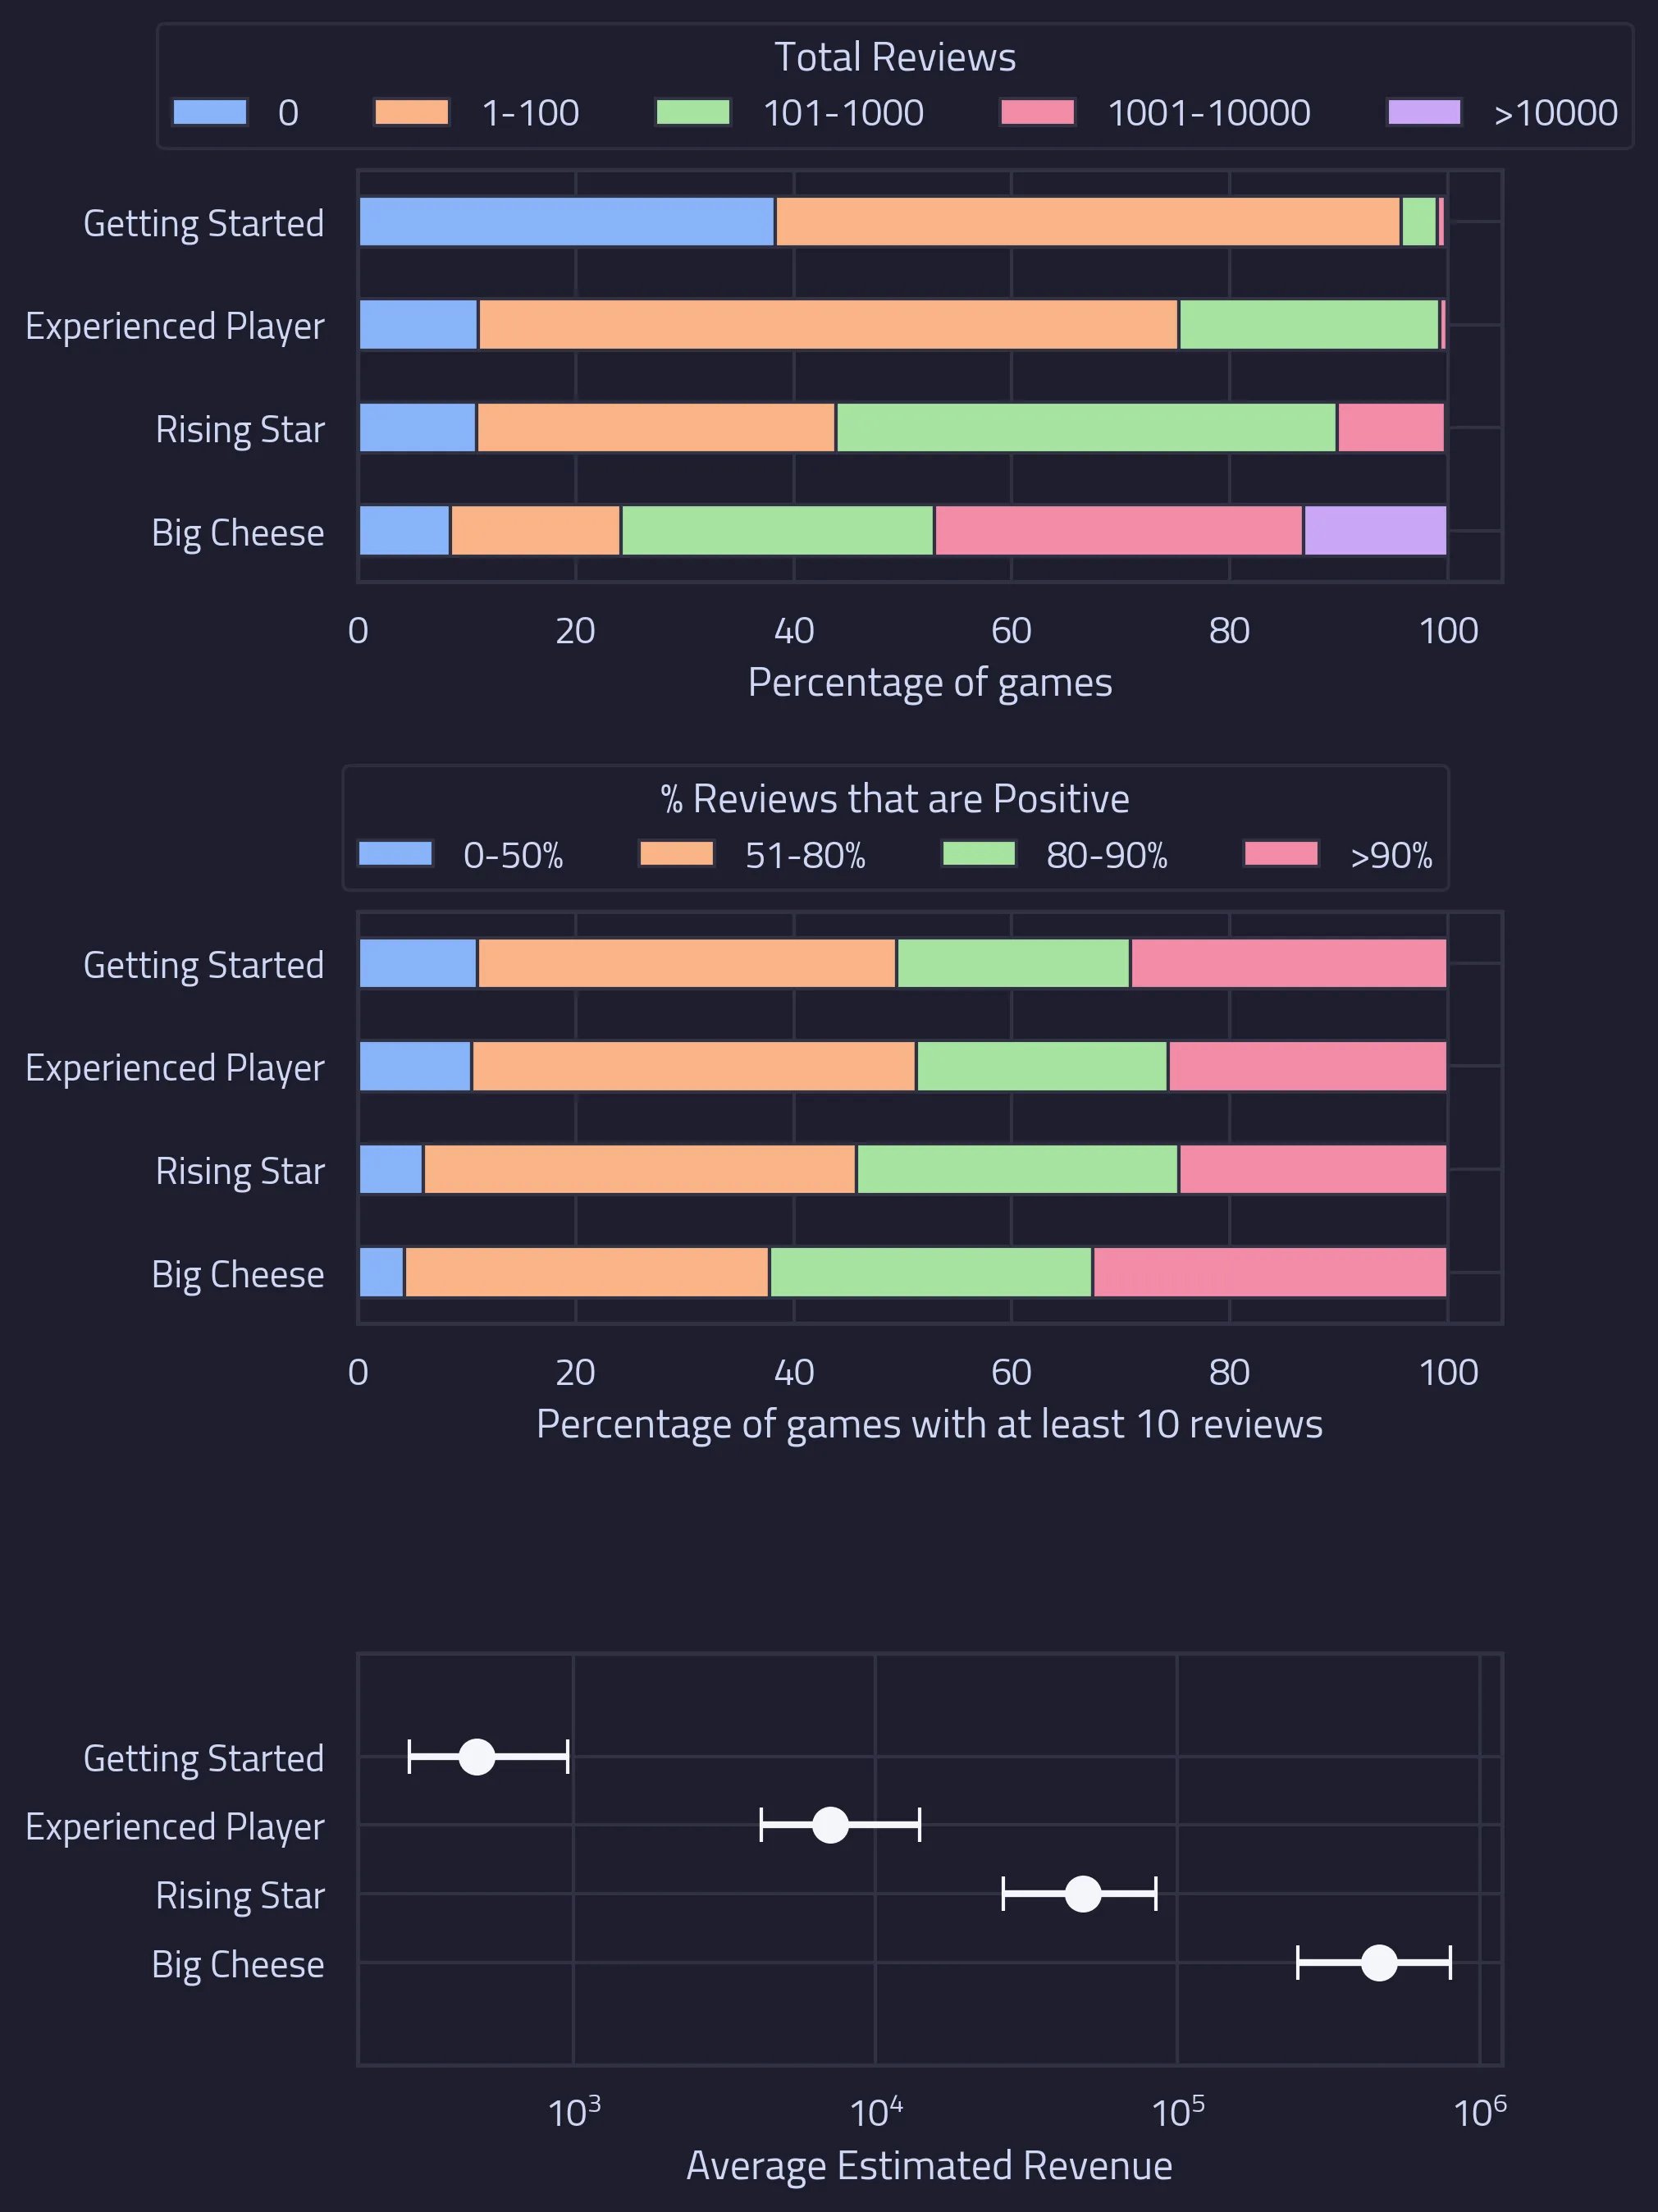
Performance metrics of games when categorised the lifetime earnings of the developer
Unsurprisingly, the bigger earners capture more reviews and therefore have a higher estimated revenue. The ‘Experienced Player’ and ‘Rising Star’ categories are the most similar in terms of average estimated revenue for each game, but the latter has a much higher proportion of games with more than 1,000 reviews. What is unexpected is the percentage of positive reviews amongst games with just 10 or more reviews - the ‘Getting Started’ category is very comparable to ‘Big Cheese’ in terms of games where more than 90% of the reviews are positive.
The ‘Getting Started’ and ‘Big Cheese’ categories were comparable again when categorising the uniqueness of games, with both seeing the lowest percentage of ‘Copycats’. It is interesting to see that the middle tiers appear to have higher volumes of such games.
Lastly and unsurprisingly, there is a clear gradient in the ranking of games amongst their peers when moving from ‘Getting Started’ to ‘Big Cheese’ with over 30% of games made by ‘Big Cheese’ developers ranking in the top 10 games amongst their 100 most similar games.
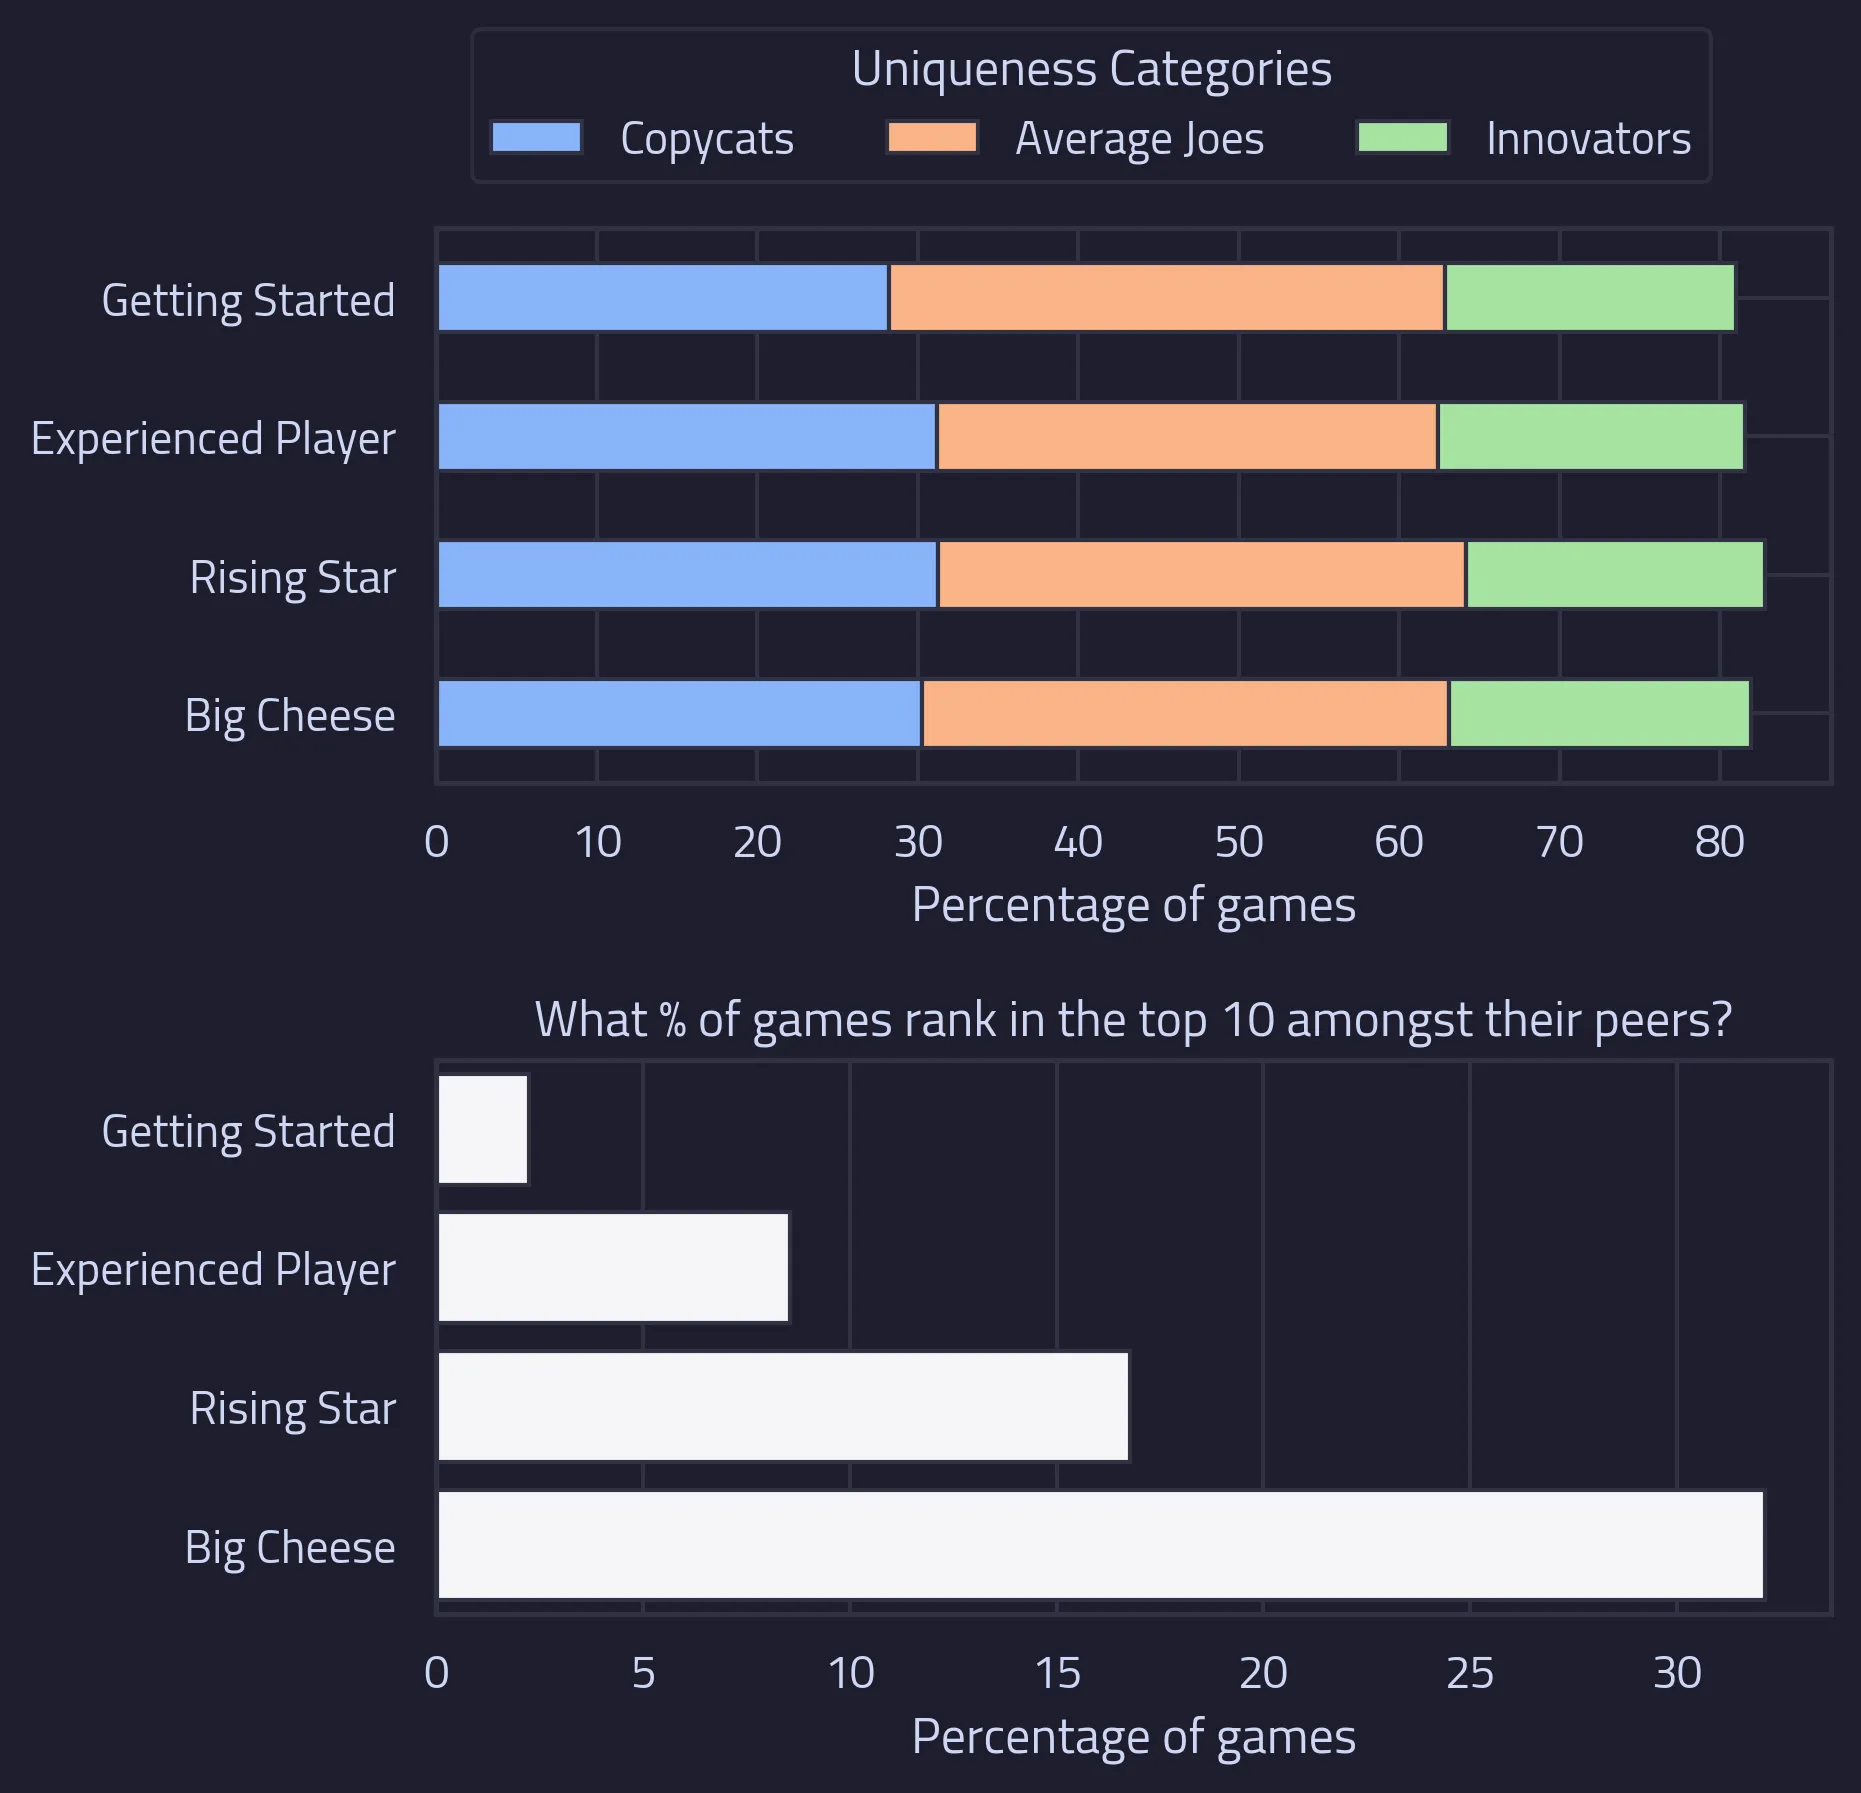
Uniqueness and ranking metrics of games when categorised the lifetime earnings of the developer
What Really is an Indie Game?
So what do we make of all this? We know for certain that the ‘indie’ tag provided by Steam is definitely not accurate. Additionally, the analysis shown in this article demonstrates that the statistics vary widely depending on your definition of ‘indie’. We have also seen that we have to make broad assumptions to fit games into our definitions.
We think the better question to ask is “why does the ‘indie’ definition matter to you?“.
When you’re developing a new game and want to establish realistic expectations, the best advice is to be kind to yourself when making comparisons to other similar titles. This was one of the key motivations behind why we developed Game Oracle and the Steam Map. Rather than using loose definitions for your competitors we think it makes sense to measure similarity with all the available data and to then focus on those competitors that are genuinely in your space - this is precisely what our Steam Map is designed for.
The analysis presented here was created using a snapshot of the Steam catalogue in May 2025 and will therefore exclude games announced/published after this date.
References
- Wikipedia | Indie Game
- Scholarly Community Encyclopedia | Independent Video Game Development
- Helpshift | What is an indie game and why is it so popular?
- Toronto Film School | What is an Indie Game? A Comprehensive Guide
- Digital Trends | The ‘Indie’ label is losing its meaning, and that’s a big problem for gaming
- Escapist Magazine | We need a new definition of indie
- RealTime | The rise of Triple-I games and how to get ahead
- GamesIndustry.biz | An era of "triple-I" development is almost here
- Statista | Number of games released on Steam worldwide from 2018 to 2023, by developer type
Share:


